Halfway Through the Year: Bozeman Real Estate Market Report
By Tim Ford – Real Estate Broker
As we reach the midpoint of 2025, Bozeman’s real estate market continues to evolve in response to shifting economic conditions, buyer behavior, and inventory trends. While interest rates remain stubbornly high and affordability challenges persist, we’re beginning to see a modest rebound in housing supply—an encouraging sign after several years of constrained inventory. In this mid-year report, we’ll take a detailed look at how the market has performed so far, from new listings and sales activity to pricing trends and broader market dynamics across the greater Bozeman area.
Supply Side Analysis
Last year was the first year in several years that saw an increase in the number of new listings, and that trend continued this year. From January 1st to July 1st; 627 single-family homes were listed for sale in the greater Bozeman area. This is up slightly from the 610 new listings last year, but shows a marked increase in new listings from the first 6 months of 2023, when 548 single family homes were listed for sale. Looking back, 585 single family homes were listed in the same period of 2022. While this year’s figure exceeds the 592 listings of 2021, it is still below the 649 homes listed in the first half of 2020 and the 722 in 2019.
These figures reflect a 10% decline in new listings from 2019 to 2020, followed by another 9% decline from 2020 to 2021. In 2022, the decline was more modest at 1%, but 2023 saw a further 6% drop. This year’s increase marks a 14% rise from 2023, although it remains 13% below 2019 levels.
Sales Performance
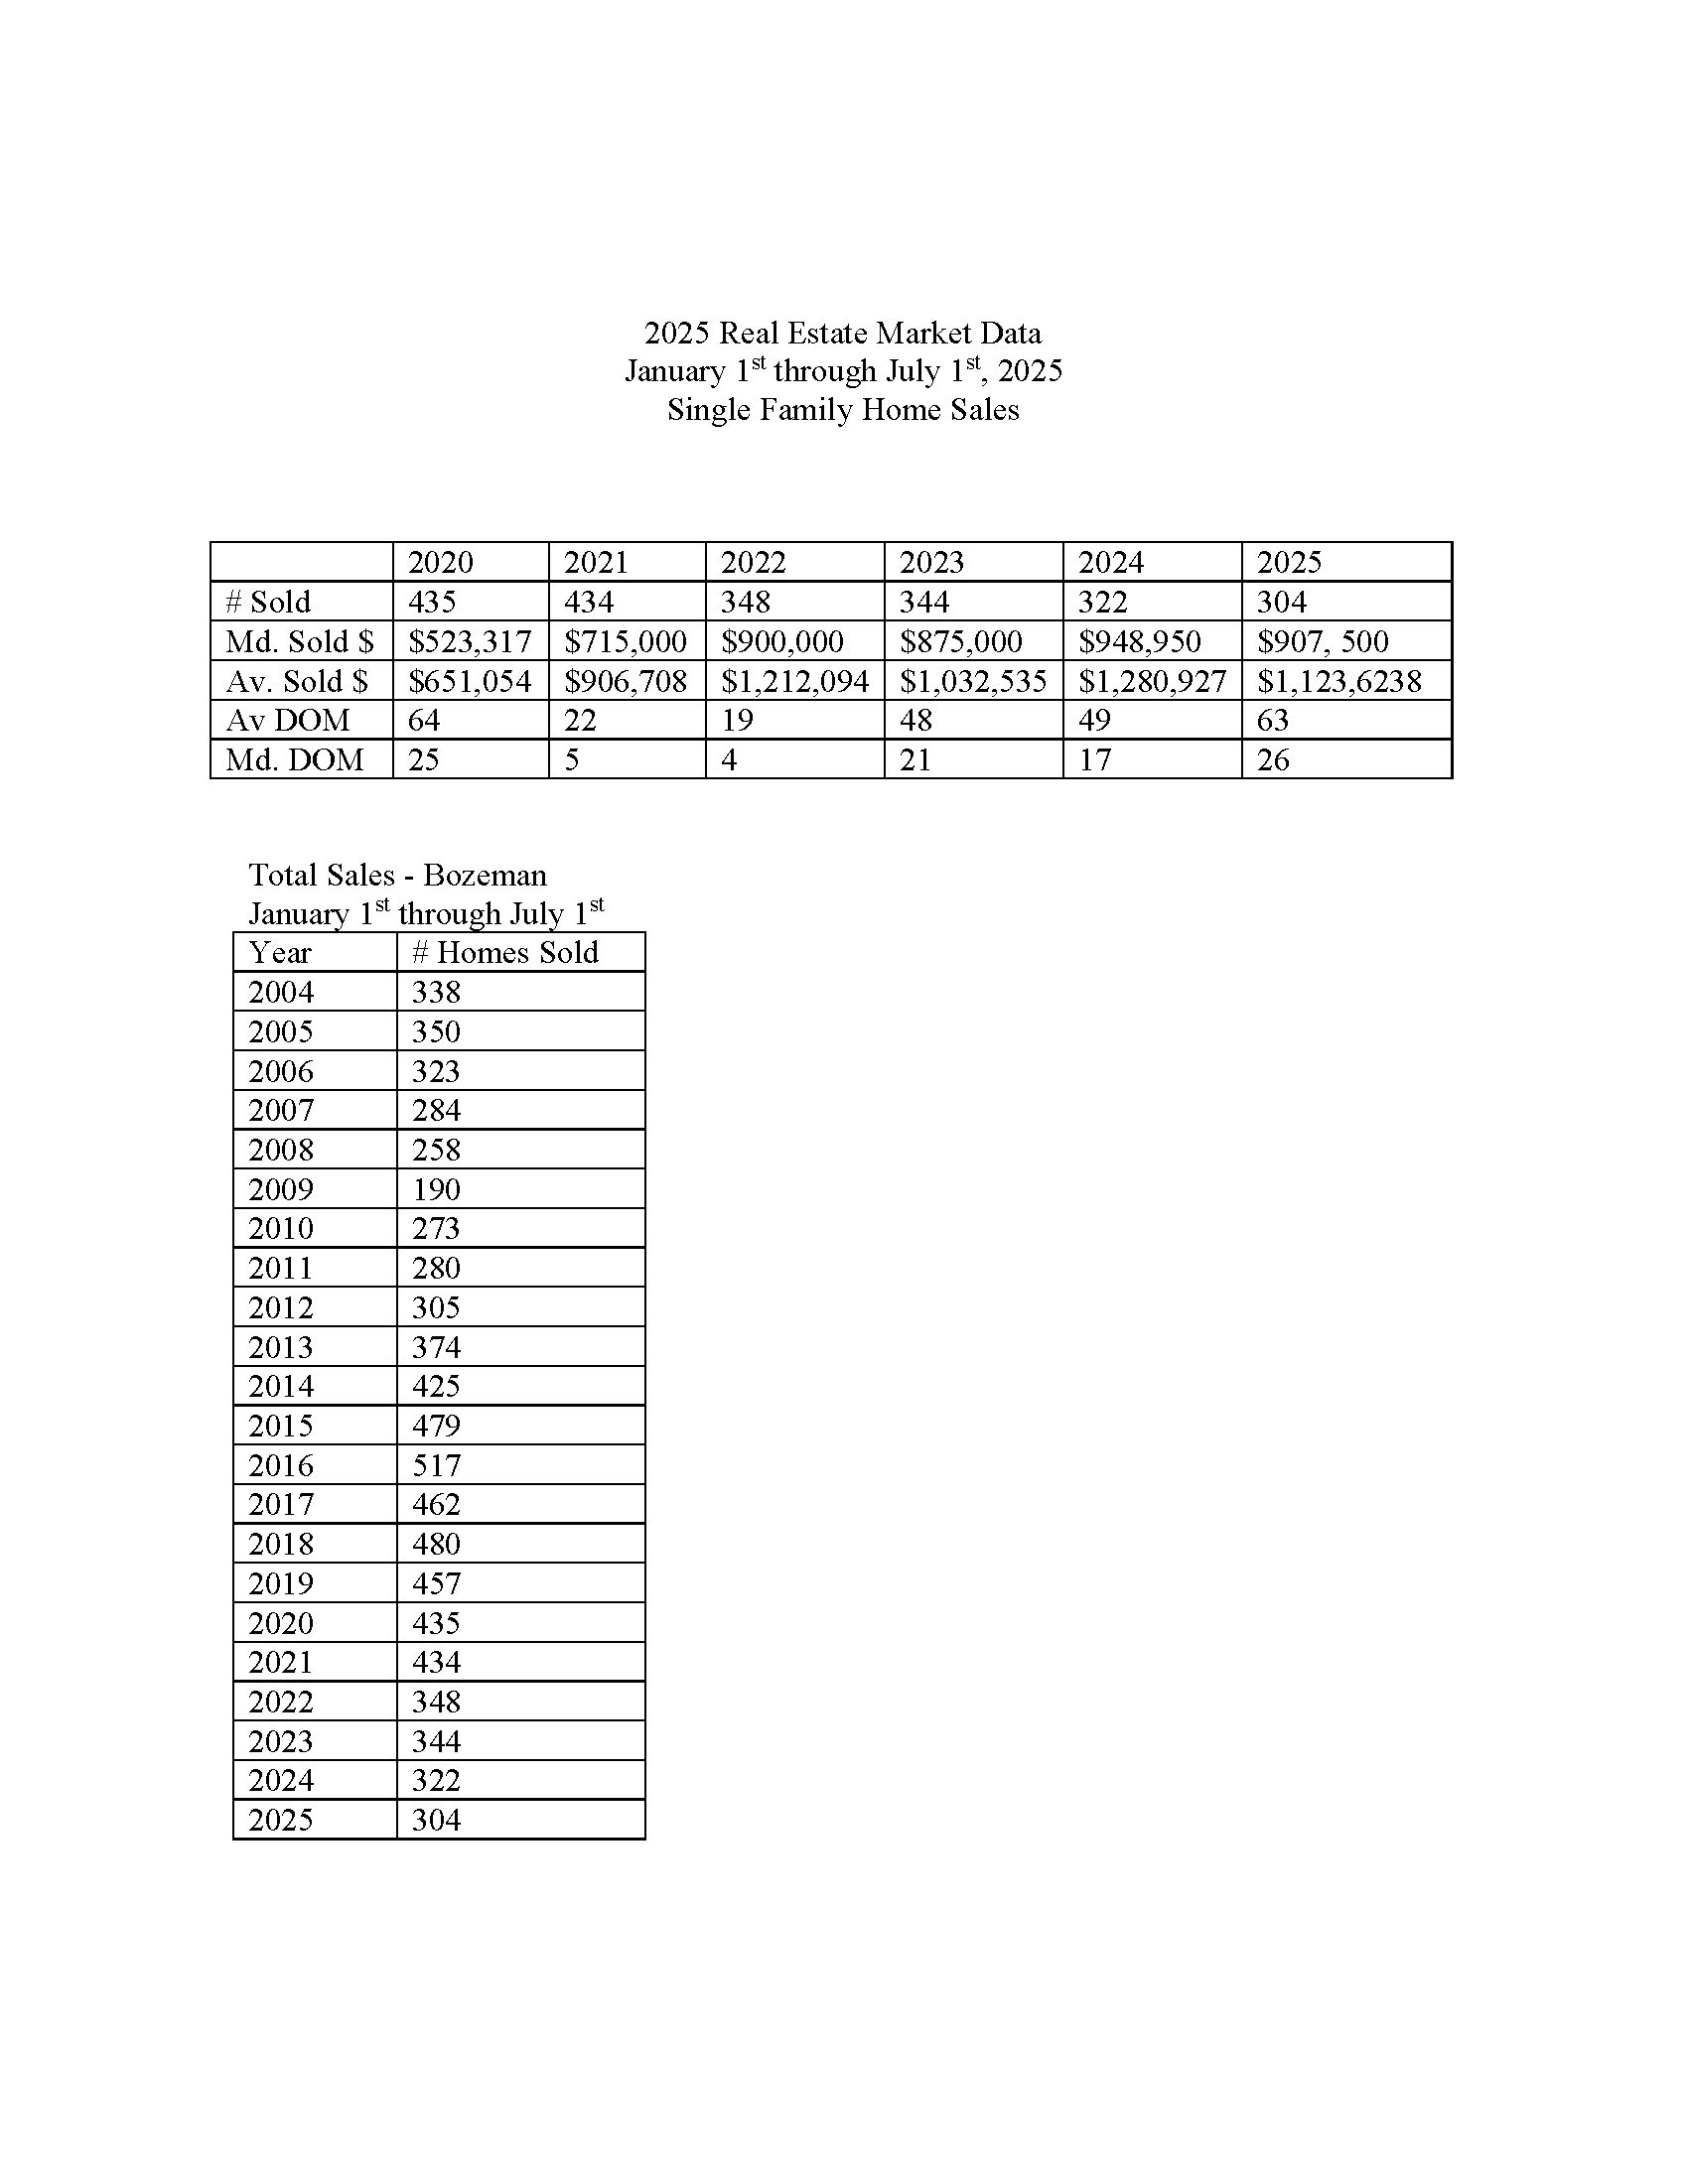
Despite the rise in new listings, sales numbers have decreased from last year. In the first half of this year; 304 single-family homes were sold in and around Bozeman, compared to 322 sales last year, 344 the year before, and 348 in the first half of 2022. Sales followed a similar trend as the number of new listings from 2021 and 2020, when 434 and 435 homes were sold, respectively.
Pending transactions are bucking the trend and are up compared to this time last year. Currently, there are 102 pending single-family home sales, which is up over 10% compared to 92 last year. Looking back further, this is down slightly from 113 at the same time in 2023, and up just slightly from 100 pending sales at this time in 2022. This is a notable decline from the pandemic years when there were 156 pending sales in 2021 and 230 in 2020.
Median Sold Price Trends
The median sold price for single-family homes, both inside and outside city limits, is bumping up and down. Median sold price is not a perfect indicator of actual home prices, but is a widely looked at gauge. After declining from $900,000 in 2022 to $875,000 in 2023, it bumped up last year to $948,950. This year, its down slightly at $907,500.
Homes outside city limits tend to be more expensive. Restricting the data to only single-family homes inside city limits; The median sold price increased by 42% from $477,750 in 2020 to $678,400 in 2021, and by another 18% to $800,000 in 2022. In 2023, this number decreased by 5% to $760,000. Last year, the median sold price inside city limits was up almost 4% from the previous year at $789,000, slightly below 2022 levels. It is also down slightly this year, declining 4.9% from last year to $750,000.
Market Dynamics
The month’s supply of homes for sale, a measure of how long it would take to sell all current listings, has increased towards pre-pandemic levels. Generally, anything below a 6-month supply is considered a seller’s market, while anything above is considered a buyer’s market. Starting around 2017, it consistently hovered around 3 months. In 2020, it dropped to around and below 1 month and remained there through 2021. It began to increase in 2022, inching up to around 3 months. This year and last year show similar numbers, with the month’s supply sitting around 4.5 months. Some consider a “normal” or “healthy” market to have a 5-to-6-month supply of homes.
The median days on market has also returned to pre-pandemic levels. In 2021, the median days on market plummeted to just 5 days, down from 25 days in 2020 and 23 days in 2019. It continued to fall to 4 days in 2022. It increased in 2023 to 21 days, decreased last year slightly to 17 days, and bumped back up again this year to 26 days on market.
Interest Rates
Interest rates remain volatile and should be monitored frequently by serious buyers. For the past 2 years, many have been hoping to see interest rates drop below 6%, but this has yet to materialize. Although they change daily, as of writing, they are slightly down from recent averages, hovering around 6.8%, depending on factors such as down payment and credit score.
The included data reflects sales of homes in the greater Bozeman area, including Four Corners, Gallatin Gateway, Bridger Canyon, and Bozeman city limits. The data includes home sales reported through the local Big Sky Country MLS, and does not include private party sales, Condominiums, or Townhouses.